Exploring the use of Microsoft Azure Machine Learning Studio for probable PTSD detection
I was recently awarded a small resource grant by Microsoft Azure for Research to explore the feasibility of using the cloud-based platform in my research. You can see the grant information here. Each award provides the researcher (or team) with Azure credits that can be used for any of the available Azure services (e.g. Virtual Machines, Storage, Databases, Hadoop, Spark, Containers and Machine Learning Studio.).
I wanted to share my first experiences of using Microsoft Azure, and so far, I am impressed! I am going to assume some prior knowledge of machine learning in this post.
What is Machine Learning Studio
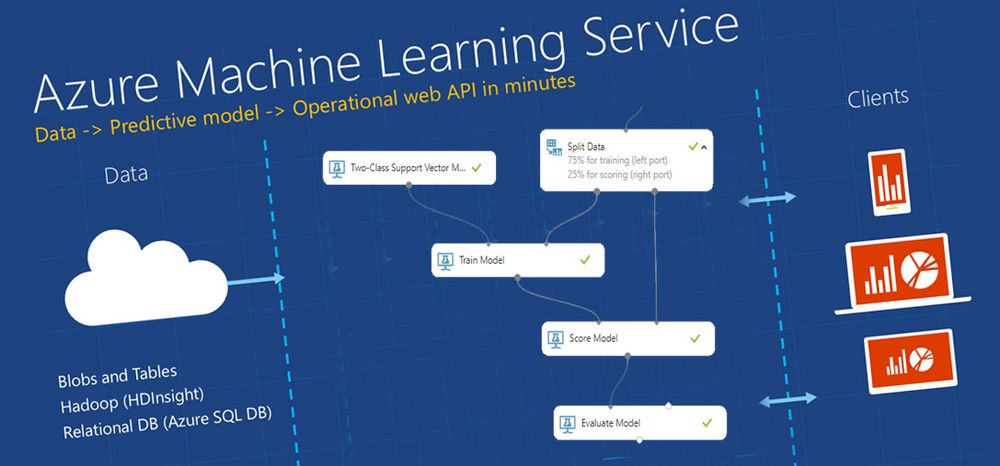
Microsoft Azure Machine Learning Studio is a collaborative, drag-and-drop tool (literally) providing machine learning to all types of users. You can use it to build, test, and deploy predictive analytics solutions on your data. A key feature is the ability to 'publish' your models as web services which can be interfaced by apps and other software. This is useful for rapid prototyping, which is often done in R&D.
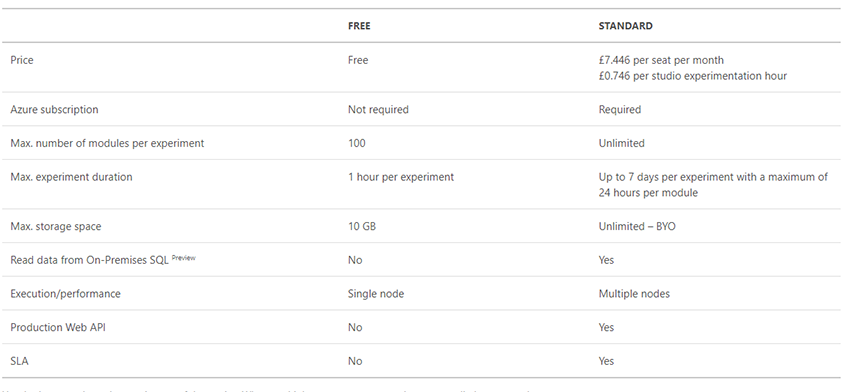
I recently started using Google Firebase as a Backend as a Service (BaaS), and Machine Learning Studio (MLS) works in a very similar way. You pay for what you use, on a per hour, per experiment and per service basis.
If you are interested in trying it yourself, they have a free data plan.
When I have spoken about cloud-based services and BaaS, I've been asked about the cost and whether it is worth it. When running training models on a local machine you are restricted by the abilities of the machine, you lose time waiting for the models to converge (hours, days or weeks) and spend a lot of money on buying suitable hardware.
Time is the commodity that's most valuable to me. It's not just the time spent waiting for the models, it's the need to test a hypothesis or change a parameter. When done locally, it takes time, but in the cloud it becomes a cost-effective (often quicker) solution. You've got to ask yourself, like I do, is it worth it? For me, the answer was/is yes.
The Experiment
To explore the features and functionality of MLS I used the Adult Psychiatric Morbidity in England - 2007, which provides data on the prevalence of both treated and untreated psychiatric disorder in the English adult population (aged 16 and over).
The objective of the experiment was two-fold:
- Can we identify features which are likely to contribute to the prediction of Post-traumatic stress disorder (PTSD) as an outcome (variable: PTSDPos).
- Can we use MLS to detect cases of PTSD via classification.
Disclaimer: This work is based on self-reported measures and does not rely on any clinical outcome measures. Simply, no clinician has confirmed the diagnoses of PTSD. Therefore, the term "probable PTSD" is used. Further, this post is not seeking to get 'the best' accuracy of result, but to show some of the capabilities of MLS.
Step 1: Data Upload
I obtained a copy of the Adult Psychiatric Morbidity in England (APMS) from the UK Data Service. It is available in multiple data formats; I grabbed a STATA version.
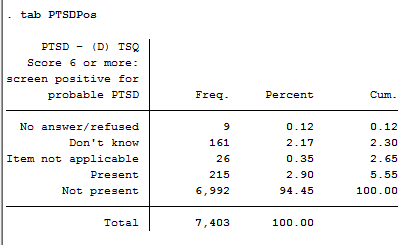
We are interested in probable PTSD outcome, currently it is coded as 5 categories, but I wanted to test a simple two-class problem. I dropped those who provided no answer/refused, don't know, and item not applicable.
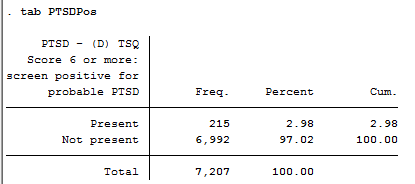
This leaves us with a sample size of n=7207 with 215 (2.98%) having probable PTSD. The file was exported as a CSV with numeric labels.
Step 2: Import Data to Experiment
Importing data into MLS is straightforward, you find the file on the local drive and upload! It then stores the files online for later use (for large files you will have to pay a fee).
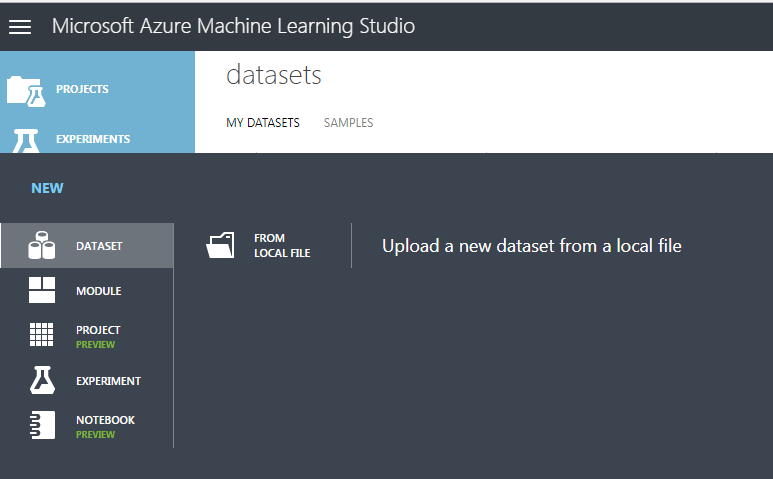
With the data uploaded you can then import it into your experiment workflow.
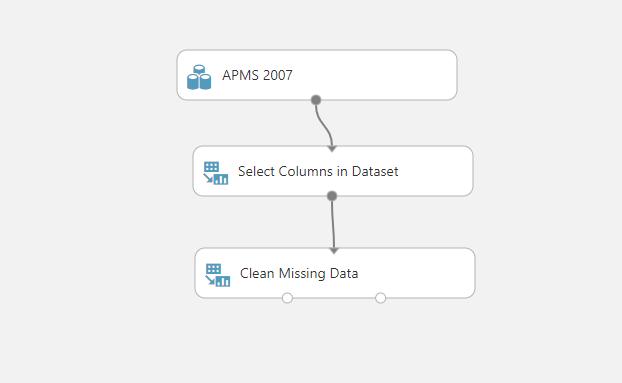
Step 3: Importing and Cleaning
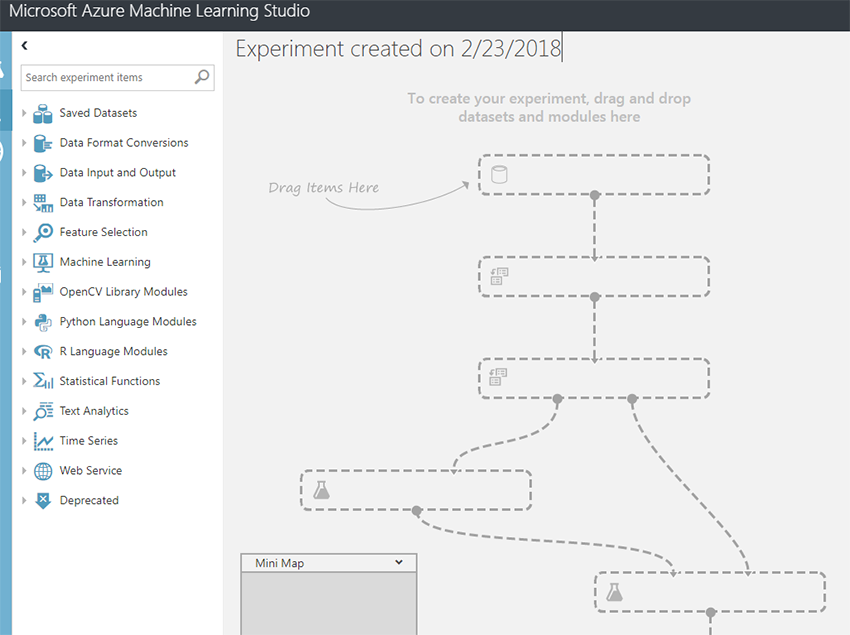
After you've created a new project, you are presented with an empty workflow. You can then start to use the widgets on the left of the screen to build your MLS workflow pipeline (e.g. import, clean, select variables, train and classify).
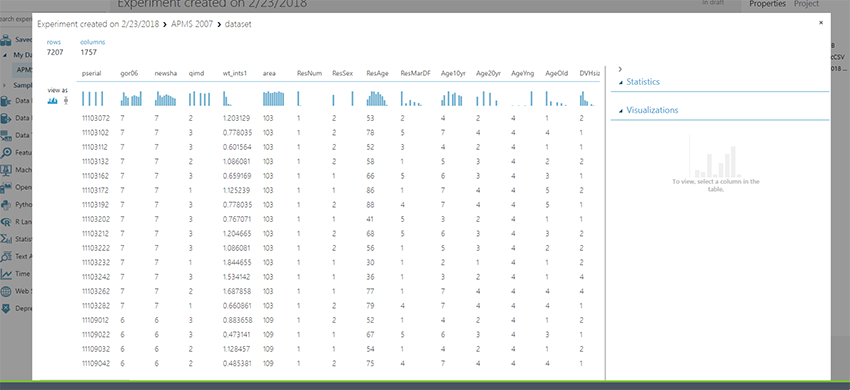
Usually using STATA, Excel or Matlab it takes a couple lines of syntax. Not in MLS - a couple of clicks gets you some really cool on-the-fly data visualisations. In the above example, you can click on any of the columns to generate multiple visualisations.
Having already imported the APMS data, I now need to select (or you can exclude) columns of the data.
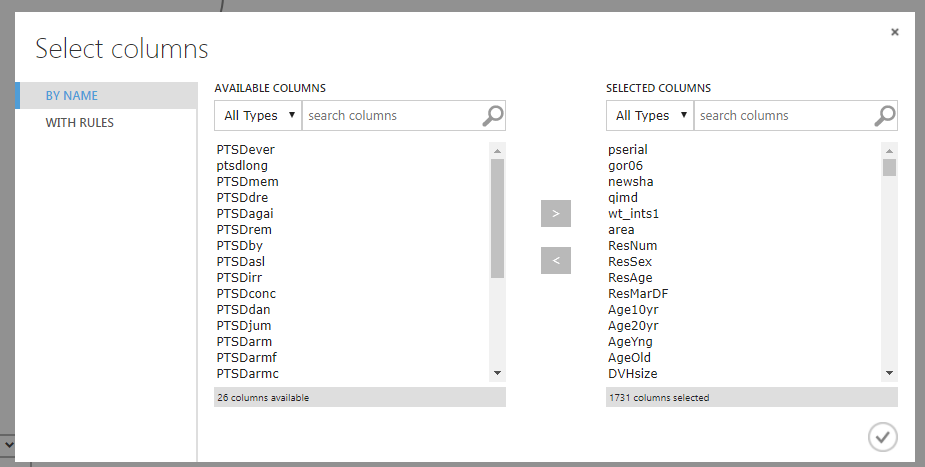
Again, it is simple, drag, drop, click, edit and save. All undertaken via the column selector window. I have chosen to remove the PTSD screening variables (e.g. PTSDever, PTSDmem, PTSDdan) but retain the variable PTSDPos, which is the outcome we are interested in predicting. Also, I removed variables related to data collection (e.g. pserial, gor06).
Missing data is present in the majority of available datasets; therefore it is always best to have a method of either removing or replacing missing values. In this example, I have instructed MLS to use probabilistic PCA to assign a value. Note: there are many other suitable methods, this is just for the example.
Step 4: Feature Selection
There are more than 1,700 variables in the APMS data, adding noise, confusion and model complexity needlessly. Therefore, it is always helpful to perform feature selection. In machine learning, feature selection is the process of selecting a subset of relevant, useful features for use in building a model.
Feature selection helps narrow the field of data to just the most valuable and contributory inputs, reducing noise and improving training performance.
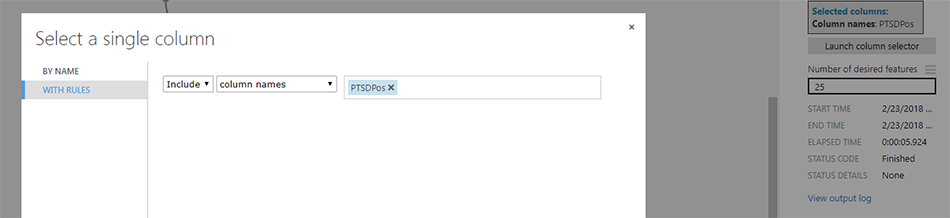
In this example, I have selected the variable PTSDPos as the main outcome, used Persons Correlation as the feature selection scoring method and requested that only 25 features are retained (in addition to the outcome variable, matrices has a width n=26).
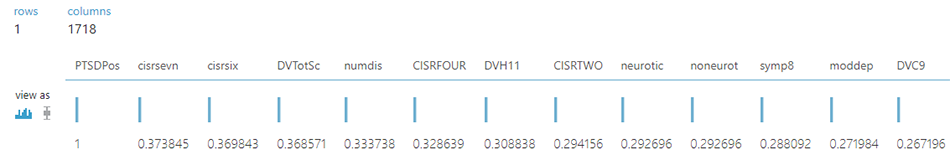
Above is an extract the first couple of variables identified during feature selection as contributing towards classifying a case of probable PTSD. While this is just an example, you always want to review each variable identified to ensure they are suitable for training.
Step 5: Training and Testing Data Split
As we are looking to perform a classification task, it is important to split the data in to training and testing datasets. The MLS workflow has a handy module for that, it is called Split Data, in this example I have split 75% of the data to the training and held back 25% for testing. It is important to note that the testing dataset (25%) is not seen when training, and only used to evaluate the final module.
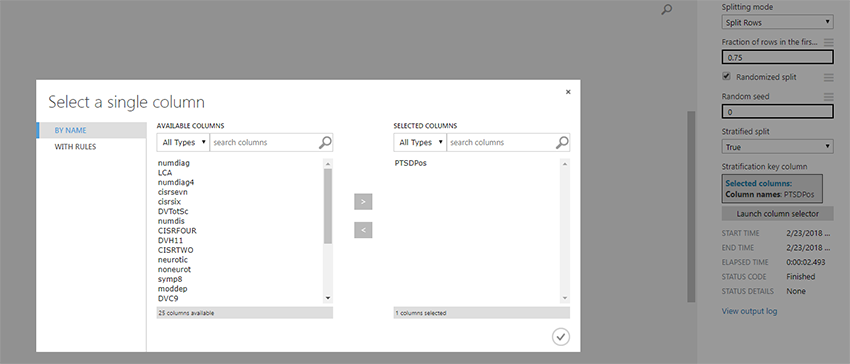
Importantly, in this example I have stratified PTSDPos column to split the data equally among the two output datasets (training and testing). Simply, ensuring we have equal numbers of probable PTSD cases in both datasets.
Step 6: Training and Evaluation
The final step is to train the machine learning algorithm and evaluate the models. In MLS it is as simple as dragging the Train Model item and Two-Class Support Vector Machines item. This then enables us to evaluate the outcome.
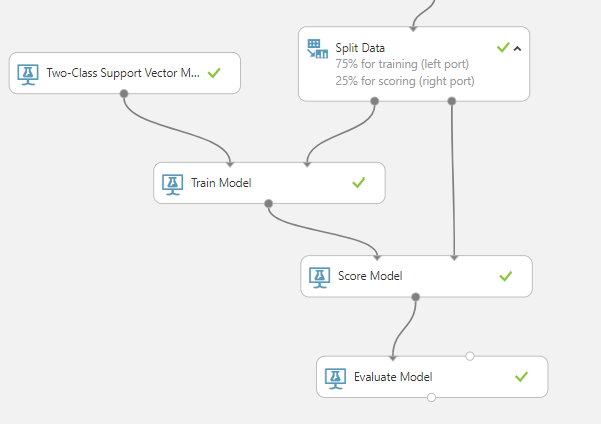
There are four items to define, Train Model, Score Model, Two-Class Support Vector Machine and Evaluation Model. There are two modules which require parameters to be defined:
- Train Model: We need to define the label column, which in this case PTSDPos.
- Two-Class Support Vector Machine: Number of iterations is set at 10 and all other parameters remain unchanged (keep defaults).
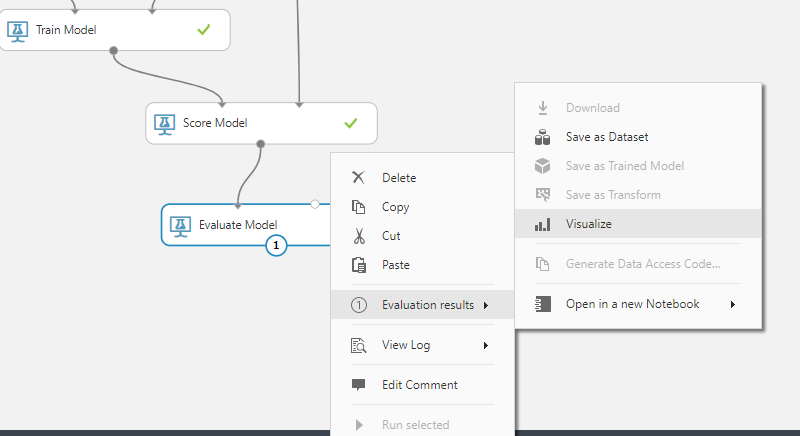
It is very easy to see the outcome of the MLS experiment, as shown above (click on visualize). It then presents several metrics to determine the success of the experiment and workflow.
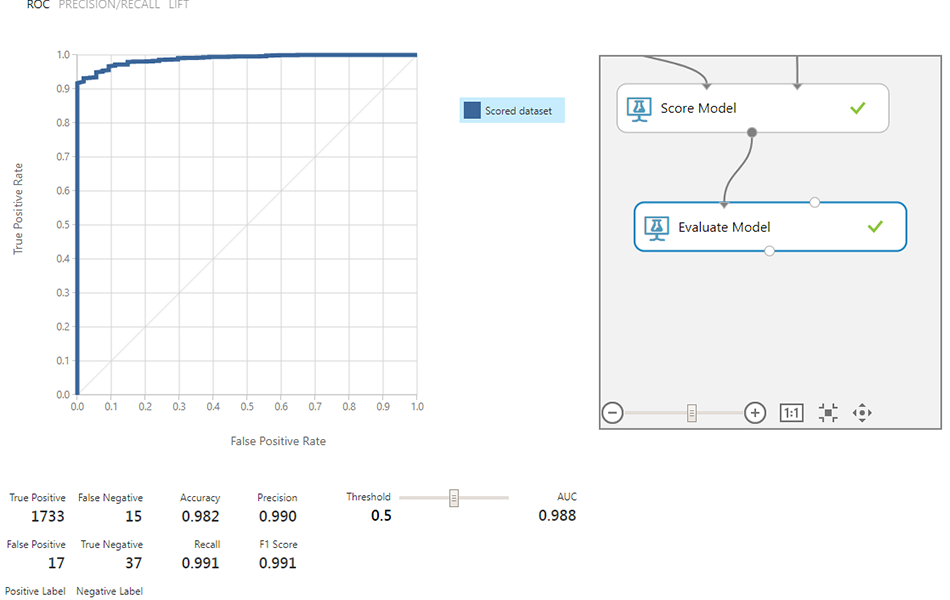
If we spent enough time exploring the dataset we could improve on these results, but as an initial 10 minute run of the data it is very promising. We can see that 37 cases have been detected as True Negatives, with only 15 False Negatives using 25 features indicative of probable PTSD.
There are multiple steps we can take to improve the detection rate, more on this in the next few months.
Final Remarks
My initial interactions with MLS are positive, it is great to see machine learning being delivered in WYSIWYG format. I do have some concerns that lack of knowledge by the end-user may result in endless experimentation to fine-tune the models without knowing what is happening in the background. The documentation provided by Microsoft is limited in explaining what impact parameters have, for example Lambda or iterations for feature selection.
A key standout feature, which I have not yet tested (I will post when I do), is the ability to deploy the trained models as a service. This means we can train a model, and then query it via an API, all supported by the Microsoft Azure framework. This opens many possibilities in using MLS in deployed research projects!
The development of MLS has focused on simplicity from the start, which is great for a research environment - you can go from rapid prototyping to deployment in a matter of days, instead of weeks or months.