Sentiment analysis of Thameslink Tweets using Python 3
This post is based on the awesome workshop and tutorial from Rodol Foferro, which you can find here.
I have wanted to undertake Twitter Natural Language Processing (NLP) for a while, and with the recent Thameslink debacle (see here and here) it is a great opportunity to explore the Twitter API and NLP. This post is designed to be a tutorial on how to extract data from Twitter and perform basic sentiment of Tweets. You can see the Gist here.
To get started, you need to ensure you have Python 3 installed, along with the following packages:
- Numpy: This is a library for scientific computing with Python;
- Pandas: This is a library used for high-performance, easy-to-use data structures and data analysis tools;
- Tweepy: This is a library for accessing the Twitter API;
- Matplotlib: This is a library which produces publication quality figures;
- Seaborn: This is a library based on matplotlib. It provides a high-level interface for drawing attractive statistical graphics (3D);
- Textblob: This is a library for processing textual data.
With that done, let's get on with the fun!
Extracting Twitter data using Tweepy
The first part is to import the required libraries.
The first stage is to import the required libraries, these can be installed via pip.
# Import core libraries
import tweepy           # Obtain Tweets
import pandas as pd     # Store and manage Tweets
import numpy as np      # Number processing

# Setup plotting and visualisation
from IPython.display import display
import matplotlib.pyplot as plt
import seaborn as sns
%matplotlib inline

print('Import libraries')
To extract Twitter Tweets, you need a Twitter account, and a Twitter Developer account. You will need to extract the following details from the Twitter Developer pages for the specific app:
- Consumer Key (API Key)
- Consumer Secret (API Secret)
- Access Token
- Access Token Secret
And save in a file called credentials.py, example as follows:
# Twitter credentials.py

# cconsumer (your) keys
CONSUMER_KEY    = ''
CONSUMER_SECRET = ''

# Access tokens
ACCESS_TOKEN  = ''
ACCESS_SECRET = ''
Why create this extra file I hear you ask? It is important to keep 'hidden' the confidential access token and secret key. Never include this information in the core of your code. Best practise to abstract away these credentials or store them as environment variables.
With the access tokens stored in credentials.py, we can then define a function and import the access tokens (e.g. from credentials import) to enable the request to be authenticated via the Twitter API.
# Import Twitter access tokens
from credentials import *

# API's authentication by defining a function
def twitter_setup():

    # Authentication and access using keys
    auth = tweepy.OAuthHandler(CONSUMER_KEY, CONSUMER_SECRET)
    auth.set_access_token(ACCESS_TOKEN, ACCESS_SECRET)

    # Obtain authenticated API
    api = tweepy.API(auth)
    return api
So far, we have setup the environment by importing the core libraries and defined the authentication API. It is now time to extract some Tweets!
We do this by defining the function get_user_tweets and call the Tweepy Cursor object. It is important to remember that each element in that list is a tweet object from Tweepy.
It is important to be aware that Twitter API limits you to about 3200 Tweets (the most recent)!
# We create an extractor object (holding the api data) by calling in our twitter_setup() function
extractor = twitter_setup()

def get_user_tweets(api, username):
        """Return a list of all tweets from the authenticated API"""
        tweets = []
        for status in tweepy.Cursor(api.user_timeline, screen_name=username).items():
            tweets.append(status)
        return tweets

alltweets = get_user_tweets(extractor, 'TLRailUK')

print("Number of tweets extracted: {}.\n".format(len(alltweets)))
Let's look at the first 5 Tweets (most recent).
Tip: It is always wise to explore your data!
# We print the most recent 5 tweets for reference
print("5 recent tweets:\n")
for tweet in alltweets[:5]:
    print(tweet.text)
    print()
5 recent tweets:

@turnipshire @SouthernRailUK @GatwickExpress Hi. Was this a delay repay? ^Neil

@kidgorge0us Hi, there are some running now but the ones that start/terminate at Blackfriars will be extended up th… https://t.co/0NVReOpydB

@richardafraser Sorry about this Richard, where are you trying to get to? ^Nat

@dancechik2 @SouthernRailUK Hi Rachael. Apologies for the ongoing disruption. We are working our hardest to try and… https://t.co/s89ngwbJ4b

@RobYoung_82 Hi Rob, it'll go as far as Kings Cross - my apologies for this. It'll be for operation reasons - I exp… https://t.co/YWLFqVRirm
Create a pandas DataFrame
We now have the Tweet data from @TLRailUK stored in a list. While we could perform analysis directly, it is a lot easier to use pandas DataFrame to allow for easy manipulation.
IPython's display function plots an output in a friendly and easily interpretable way, and the head method of a DataFrame allows us to visualize a select number of elements of the DataFrame, in this case, 10.
# We create a pandas DataFrame as follows
# Note: We loop through each element and add it to the DataFrame
data = pd.DataFrame(data=[tweet.text for tweet in alltweets], columns=['Tweets'])

# We display the first 10 elements of the DataFrame:
display(data.head(10))
| Tweets | |
|---|---|
| 0 | @turnipshire @SouthernRailUK @GatwickExpress H... |
| 1 | @kidgorge0us Hi, there are some running now bu... |
| 2 | @richardafraser Sorry about this Richard, wher... |
| 3 | @dancechik2 @SouthernRailUK Hi Rachael. Apolog... |
| 4 | @RobYoung_82 Hi Rob, it'll go as far as Kings ... |
| 5 | @skindada Hi. This should be included with you... |
| 6 | @worldwidewil80 we are very sorry for the dela... |
| 7 | @Jasontart @hselftax @tlupdates we apologise f... |
| 8 | @Freewheel1ng @hitchincommuter @GNRailUK we ar... |
| 9 | @LiamConnors2 Hi Liam, we have an amended serv... |
The DataFrame makes it easier to read the data, but also ensures it is ordered and manageable.
Side note: As Rodol Foferro points out, the Tweet structure (in this case alltweets list) has a number of internal methods we can call, to find them, do the following:
print(dir(alltweets[0]))
['__class__', '__delattr__', '__dict__', '__dir__', '__doc__', '__eq__', '__format__', '__ge__', '__getattribute__', '__getstate__', '__gt__', '__hash__', '__init__', '__init_subclass__', '__le__', '__lt__', '__module__', '__ne__', '__new__', '__reduce__', '__reduce_ex__', '__repr__', '__setattr__', '__sizeof__', '__str__', '__subclasshook__', '__weakref__', '_api', '_json', 'author', 'contributors', 'coordinates', 'created_at', 'destroy', 'entities', 'favorite', 'favorite_count', 'favorited', 'geo', 'id', 'id_str', 'in_reply_to_screen_name', 'in_reply_to_status_id', 'in_reply_to_status_id_str', 'in_reply_to_user_id', 'in_reply_to_user_id_str', 'is_quote_status', 'lang', 'parse', 'parse_list', 'place', 'retweet', 'retweet_count', 'retweeted', 'retweets', 'source', 'source_url', 'text', 'truncated', 'user']
You can see from the output the metadata contained in a single Tweet. We can extract any of the attributes listed above by doing the following:
# Print a selection of attributes from the first Tweet
print(alltweets[0].id)
print(alltweets[0].created_at)
print(alltweets[0].source)
print(alltweets[0].favorite_count)
print(alltweets[0].retweet_count)
print(alltweets[0].geo)
print(alltweets[0].coordinates)
print(alltweets[0].entities)
1007646739921293319
2018-06-15 15:31:18
CX Social
0
0
None
None
{'hashtags': [], 'symbols': [], 'user_mentions': [{'screen_name': 'turnipshire', 'name': 'Sarah Turner', 'id': 18056977, 'id_str': '18056977', 'indices': [0, 12]}, {'screen_name': 'SouthernRailUK', 'name': 'Southern', 'id': 171114552, 'id_str': '171114552', 'indices': [13, 28]}, {'screen_name': 'GatwickExpress', 'name': 'Gatwick Express', 'id': 163816182, 'id_str': '163816182', 'indices': [29, 44]}], 'urls': []}
To ensure a manageable DataFrame, you should only import the attributes that are needed for the task at hand. In this case, we are only looking to analyse the sentiment and popularity of Tweets. Therefore, we only need attributes that hold this information.
Data minimization in the workspace is key here...
# Add attributes of interest
data['len']  = np.array([len(tweet.text) for tweet in alltweets])
data['ID']   = np.array([tweet.id for tweet in alltweets])
data['Date'] = np.array([tweet.created_at for tweet in alltweets])
data['Source'] = np.array([tweet.source for tweet in alltweets])
data['Likes']  = np.array([tweet.favorite_count for tweet in alltweets])
data['RTs']    = np.array([tweet.retweet_count for tweet in alltweets])

# Display of first 10 elements from DataFrame
display(data.head(10))
| Tweets | len | ID | Date | Source | Likes | RTs | |
|---|---|---|---|---|---|---|---|
| 0 | @turnipshire @SouthernRailUK @GatwickExpress H... | 78 | 1007646739921293319 | 2018-06-15 15:31:18 | CX Social | 0 | 0 |
| 1 | @kidgorge0us Hi, there are some running now bu... | 140 | 1007646348487913472 | 2018-06-15 15:29:45 | CX Social | 0 | 0 |
| 2 | @richardafraser Sorry about this Richard, wher... | 78 | 1007645784878264320 | 2018-06-15 15:27:30 | CX Social | 0 | 0 |
| 3 | @dancechik2 @SouthernRailUK Hi Rachael. Apolog... | 140 | 1007645725633675264 | 2018-06-15 15:27:16 | CX Social | 0 | 0 |
| 4 | @RobYoung_82 Hi Rob, it'll go as far as Kings ... | 140 | 1007645479000330240 | 2018-06-15 15:26:17 | CX Social | 0 | 0 |
| 5 | @skindada Hi. This should be included with you... | 92 | 1007644426020315142 | 2018-06-15 15:22:06 | CX Social | 0 | 0 |
| 6 | @worldwidewil80 we are very sorry for the dela... | 106 | 1007643727878348801 | 2018-06-15 15:19:20 | CX Social | 0 | 0 |
| 7 | @Jasontart @hselftax @tlupdates we apologise f... | 124 | 1007643354199404544 | 2018-06-15 15:17:51 | CX Social | 0 | 0 |
| 8 | @Freewheel1ng @hitchincommuter @GNRailUK we ar... | 89 | 1007637878602682368 | 2018-06-15 14:56:05 | CX Social | 0 | 0 |
| 9 | @LiamConnors2 Hi Liam, we have an amended serv... | 140 | 1007637363168858112 | 2018-06-15 14:54:03 | CX Social | 0 | 0 |
So far, we have obtained the Tweets from Twitter, imported them in to a DataFrame and now it is time to perform some analysis!
Visualisation and basic statistics
Averages and popularity
We first want to calculate some basic statistics, such as the mean of the length of characters used in the Tweets, the Tweet with the most likes and retweets. This allows us to understand, at a top level, the structure of the data, and popularity.
You can obtain the mean using numpy package, which works well with pandas DataFrame.
# We extract the mean of lenghts
mean = np.mean(data['len'])

print("The lenght's average in tweets: {}".format(mean))
This gives us an output of: The lenght's average in tweets: 110.5602465331279
To gain further insights, we can use functions built in to pandas. Such as:
# We extract the tweets which were the most favourited and retweeted
fav_max = np.max(data['Likes'])
rt_max  = np.max(data['RTs'])

fav = data[data.Likes == fav_max].index[0]
rt  = data[data.RTs == rt_max].index[0]

# Max favorited
print("The tweet with more likes is: \n{}".format(data['Tweets'][fav]))
print("Number of likes: {}".format(fav_max))
print("{} characters.\n".format(data['len'][fav]))

# Max retweet
print("The tweet with more retweets is: \n{}".format(data['Tweets'][rt]))
print("Number of retweets: {}".format(rt_max))
print("{} characters.\n".format(data['len'][rt]))
The tweet with more likes is:
@catherinerusse2 Hi Catherine. The 06.18 is expected to run - https://t.co/bmg0Twjqwt

Appreciate you are frustrate… https://t.co/o8HUJTgLBx
Number of likes: 38
140 characters.

The tweet with more retweets is:
⚠️ An amended timetable is in operation today. Only services we plan to run will be showing in online journey plann… https://t.co/p0RsxTPi6b
Number of retweets: 9
140 characters.
With that done, we can now begin to visualise some of the data.
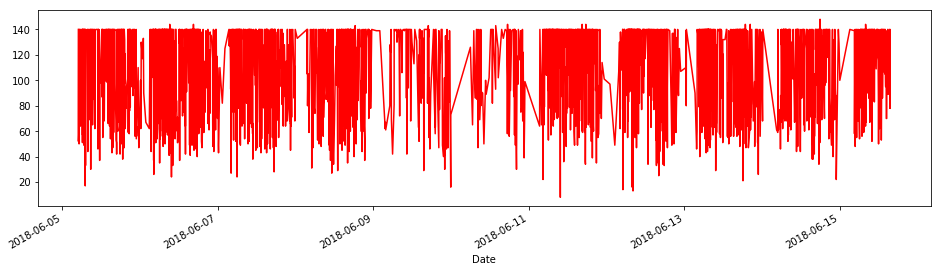
Time series
Pandas has its own object to handle time series data. Since, by Twitters very nature, we have time series data (variable created_at). We can construct a plot of all Tweets with respect to Tweets lengths, likes and retweets.
# We create time series by using length, likes and retweets
tlen = pd.Series(data=data['len'].values, index=data['Date'])
tfav = pd.Series(data=data['Likes'].values, index=data['Date'])
tret = pd.Series(data=data['RTs'].values, index=data['Date'])
And if we want to plot the time series, pandas again has its own method in the object.
# Lenghts using time
tlen.plot(figsize=(16,4), color='r');
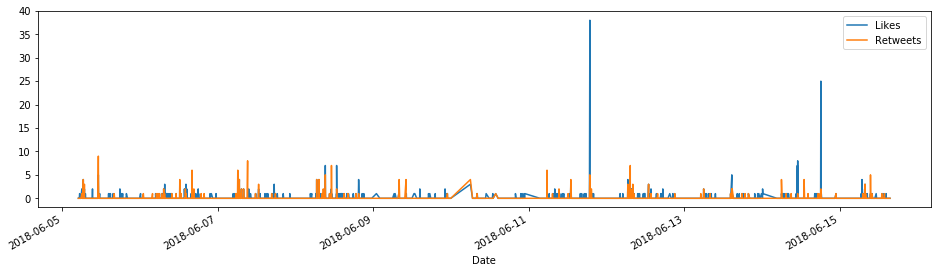
And to plot the likes versus the retweets in the same chart:
# Likes vs retweets plot
tfav.plot(figsize=(16,4), label="Likes", legend=True)
tret.plot(figsize=(16,4), label="Retweets", legend=True);
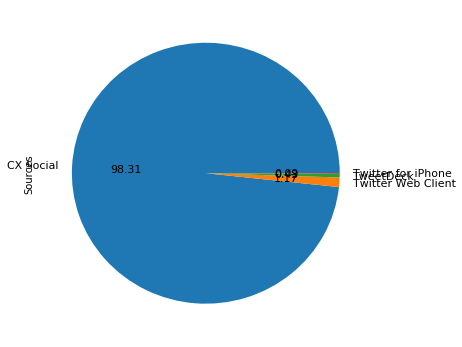
Pie charts of sources
The next part is to explore how Tweets are being made, as not every Tweet is sent from the same source. We do this by using the source variable.
# We obtain all possible sources from the data
sources = []
for source in data['Source']:
    if source not in sources:
        sources.append(source)

# We print the source list
print("Creation of content sources:")
for source in sources:
    print("* {}".format(source))
Creation of content sources:
* CX Social
* Twitter Web Client
* TweetDeck
* Twitter for iPhone
We can see from the output that @TLRailUK Tweets from four platforms. We can use this information to count the frequency of occurrence and plot it as a pie chart.
# We create a numpy vector and map it to the labels
percent = np.zeros(len(sources))

for source in data['Source']:
    for index in range(len(sources)):
        if source == sources[index]:
            percent[index] += 1
            pass

percent /= 100

# Render the pie chart:
pie_chart = pd.Series(percent, index=sources, name='Sources')
pie_chart.plot.pie(fontsize=11, autopct='%.2f', figsize=(6, 6));
Sentiment analysis
We can use TextBlob library to perform sentiment analysis. We use the re library, which uses regular expressions. This is performed in two stages:
- Clean the Tweets which means that any symbol distinct to an alphanumeric value will be re-mapped into a new value;
- Create the classifier to assess the popularity of each.
This is achieved as follows.
from textblob import TextBlob      #Import NLP package
import re                          #Import re for regex

def clean_tweet(tweet):
    '''
    Utility function to clean the text in a Tweet by removing
    links and special characters using regex re.
    '''
    return ' '.join(re.sub("(@[A-Za-z0-9]+)|([^0-9A-Za-z \t])|(\w+:\/\/\S+)", " ", tweet).split())

def analize_sentiment(tweet):
    '''
    Utility TextBlob to classify the polarity of a Tweet
    using TextBlob.
    '''
    analysis = TextBlob(clean_tweet(tweet))
    if analysis.sentiment.polarity > 0:
        return 1
    elif analysis.sentiment.polarity == 0:
        return 0
    else:
        return -1
The TextBlob comes pre-packaged with a trained classifier, which means you do not need to train, code or label any data (you can if you want to…). The TextBlob library has been designed to work with different machine learning algorithms (I’ll be posting more about this in future), and can be inter-linked with other data science and NLP packages.
When you pass each Tweet to the classifier, it assesses the sentiment as positive, negative or neutral. Once a score has been defined, a new column is created in the DataFrame.
# We create a column populated with the sentiment score
data['SA'] = np.array([ analize_sentiment(tweet) for tweet in data['Tweets'] ])

# We display the DataFrame with updated score
display(data.head(10))
| Tweets | len | ID | Date | Source | Likes | RTs | SA | |
|---|---|---|---|---|---|---|---|---|
| 0 | @turnipshire @SouthernRailUK @GatwickExpress H... | 78 | 1007646739921293319 | 2018-06-15 15:31:18 | CX Social | 0 | 0 | 0 |
| 1 | @kidgorge0us Hi, there are some running now bu... | 140 | 1007646348487913472 | 2018-06-15 15:29:45 | CX Social | 0 | 0 | 0 |
| 2 | @richardafraser Sorry about this Richard, wher... | 78 | 1007645784878264320 | 2018-06-15 15:27:30 | CX Social | 0 | 0 | -1 |
| 3 | @dancechik2 @SouthernRailUK Hi Rachael. Apolog... | 140 | 1007645725633675264 | 2018-06-15 15:27:16 | CX Social | 0 | 0 | 0 |
| 4 | @RobYoung_82 Hi Rob, it'll go as far as Kings ... | 140 | 1007645479000330240 | 2018-06-15 15:26:17 | CX Social | 0 | 0 | 1 |
| 5 | @skindada Hi. This should be included with you... | 92 | 1007644426020315142 | 2018-06-15 15:22:06 | CX Social | 0 | 0 | 0 |
| 6 | @worldwidewil80 we are very sorry for the dela... | 106 | 1007643727878348801 | 2018-06-15 15:19:20 | CX Social | 0 | 0 | -1 |
| 7 | @Jasontart @hselftax @tlupdates we apologise f... | 124 | 1007643354199404544 | 2018-06-15 15:17:51 | CX Social | 0 | 0 | 0 |
| 8 | @Freewheel1ng @hitchincommuter @GNRailUK we ar... | 89 | 1007637878602682368 | 2018-06-15 14:56:05 | CX Social | 0 | 0 | 0 |
| 9 | @LiamConnors2 Hi Liam, we have an amended serv... | 140 | 1007637363168858112 | 2018-06-15 14:54:03 | CX Social | 0 | 0 | 0 |
As we can see, the last column contains the sentiment score (SA).
Analysing the results
In this post, I will provide a top-level summary of the results (I'll provide more details in a future post). This will be a percentage of the number of positive, negative or neutral Tweets.
# We determine the score for the Tweet
pos_tweets = [ tweet for index, tweet in enumerate(data['Tweets']) if data['SA'][index] > 0]
neu_tweets = [ tweet for index, tweet in enumerate(data['Tweets']) if data['SA'][index] == 0]
neg_tweets = [ tweet for index, tweet in enumerate(data['Tweets']) if data['SA'][index] < 0]

# We print percentages
print("Percentage of positive tweets: {}%".format(len(pos_tweets)*100/len(data['Tweets'])))
print("Percentage of neutral tweets: {}%".format(len(neu_tweets)*100/len(data['Tweets'])))
print("Percentage of negative tweets: {}%".format(len(neg_tweets)*100/len(data['Tweets'])))
Percentage of positive tweets: 21.10939907550077%
Percentage of neutral tweets: 47.057010785824346%
Percentage of negative tweets: 31.833590138674886%
As you would expect, most of the tweets are neutral. However, they do have several negative Tweets. Possibly related to the timetabling issue they are current experiencing. What is important to remember, we are only dealing with about 3200 Tweets, the most recent ones. Twitter, sadly, does not allow for more historical analysis. This analysis was performed pre-rush hour.
This post was intended as a basic introduction, more blog posts are in the pipeline, which describe more complex analysis.